We turned EVERY Citrini tweet into a trade and beat the S&P 500 by 26 points
Direct copying of whatever stock gets bullposted underperforms the S&P 500 by 40 percentage points. The Citrini Basket beat it by 26. Here’s why.

For a while now, folks on X have been saying that Citrini's posts move stocks, and plenty of people trade on that belief without ever checking it. We wanted to check it, and more specifically, we wanted to know how we could put such a strategy to work. So the Treasures team trawled through an extensive number of Citrini’s past tweets, wrote down numerous sets of varying mechanical rules that would turn them into trades, and implemented those rules against actual past performances of the assets involved.
Here is what we found: Direct copying of whatever stock gets bullposted, as soon as it is posted, underperforms the S&P 500 by 40 percentage points (-22% vs the S&P’s +18%). Why? In short, we found a correlation between when a bullpost happens and peak attention on the stock (which often precedes a slight correction).
A more contained set of rules, which we will label the Citrini Basket, made +43%; outperforming the S&P 500 by 26 percentage points. The rules are simple: Hold up to seven of the most-talked-about names and refresh them once a week. Getting to the Citrini Basket as the final answer was not simple - it meant trying and throwing out more than thirty other sets of rules, most of which either lost money or did no better than a plain chip-stock fund.
SPOILER: The Citrini Basket goes live on Copytrade by Treasures tomorrow.
Dear reader, now that we have given you the answers, we must first warn you that the rest of this article will involve a fair bit of numbers. If you are not a numbers-person, here are the four key points you’ll just need to take away before you go:
- Blatantly copying will lose you money,
- An iterative process is necessary to find the optimal strategy,
- Most of the returns come from catching the right narrative (e.g. the chip boom), and
- Time in the market beats timing the market (i.e. don’t overtrade)
Why we bothered
Everybody wants to act on Citrini’s content, but few have really measured it. This is usually where the interesting answers lie: either the crowd is right and there is something mechanical to capture, or the crowd is wrong and there are some second order effects making it look right.
It is also a practical question. If you follow the account and act on the posts, you are already running your own set of rules, written down or not. The only question is whether it is a good one.
So we put the pieces together to answer it: 2,716 public posts from October 2025 to October 2026; an algorithm that reads each post and works out which stock it references (Citrini almost never uses $TICKER tags, so a keyword search would miss 99% of mentions); a replay system that runs our live trading code one day at a time against those posts; and an engine that trades the result for anyone who follows it.
The ground rules
A backtest is the easiest way in finance to fool yourself. If you are allowed to look at the past while you build a rule, you can always find one that would have worked. So before any result counted, it had to pass three rules:
- Trade only what you could have known. A post counts from the next trading day, and the trade is done at that day's closing price. We built in an assumed 0.3% in extra costs and slippage into each trade, to be conservative.
- Write the rules down before running it. Every set of rules was written out in full, including what we expected them to do, before they touched the data. None were adjusted after we saw the result.
- Judge the set of rules on months it never saw. We tuned different sets of rules on May 2026 to October 2026 tweets (“Tuning Months”), then ran them unchanged on a completely different set of tweets from October 2025 to April 2026 (“Test Months”). Any set of rules that only worked on the months it was tuned on was thrown out.
We also ran three sanity checks on every idea: (1) shuffling the algorithm's positive-or-negative labels at random and see if the result changes; (2) swapping the picked stocks for random ones from the same list; and (3) comparing each basket to a plain chip-stock ETF held in the same proportions, because most of the names Citrini talks about are semiconductor and AI-hardware stocks, and a basket of them will rise and fall with that sector whether or not the account knows anything.
The Citrini Basket
Let’s jump straight to the final answer before we revisit what did not work: The Citrini Basket.
Once a week, after Friday's close, we look at which stocks the account has spoken about positively over the last six weeks. We rank them by attention (how often they came up, how recently, and how many likes those posts drew) and buy the top seven. Each stock stays in the basket for at least six weeks to reduce unnecessary turnover. No stock gets more than 15% of the money, jumpier stocks get smaller slices, and when fewer than seven names qualify, the remainder sits in cash.
The chart below shows what $100 would have become over the past year inside the Citrini Basket, compared against three scenarios: (1) Copying every post, (2) The S&P500, and (3) The Chip-stock ETF.
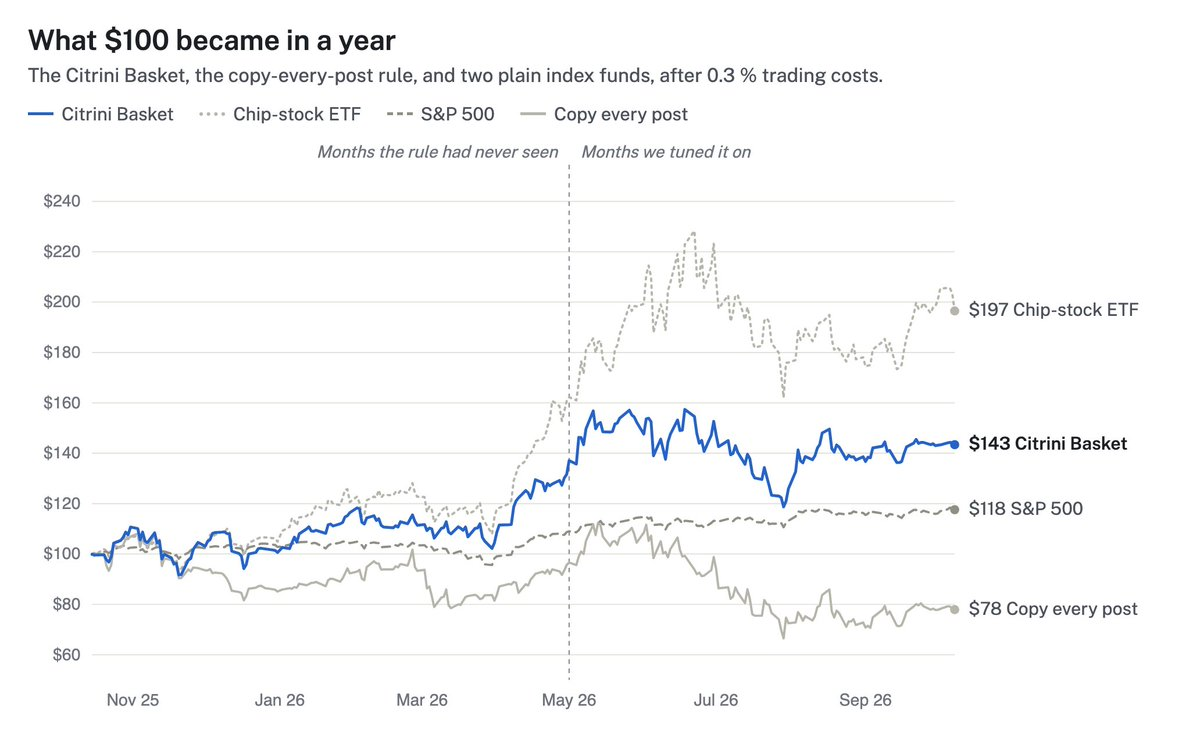
Chart 1: Backtest simulation across 247 trading days (15 Oct 2025 to 8 Oct 2026), net of 0.3% estimated trading costs.
The table below summarizes the chart into three distinct time periods: (1) the full year (2) the “Test Months”, and (3) the “Tuning Months”. For each time period, the performance of the Citrini Basket was pitted against the S&P500 and the Chip-stock ETF.
Note: The Citrini Basket was run on the two six-month periods separately, each starting from a pure cash position, so they do not compound to the full-year figure.
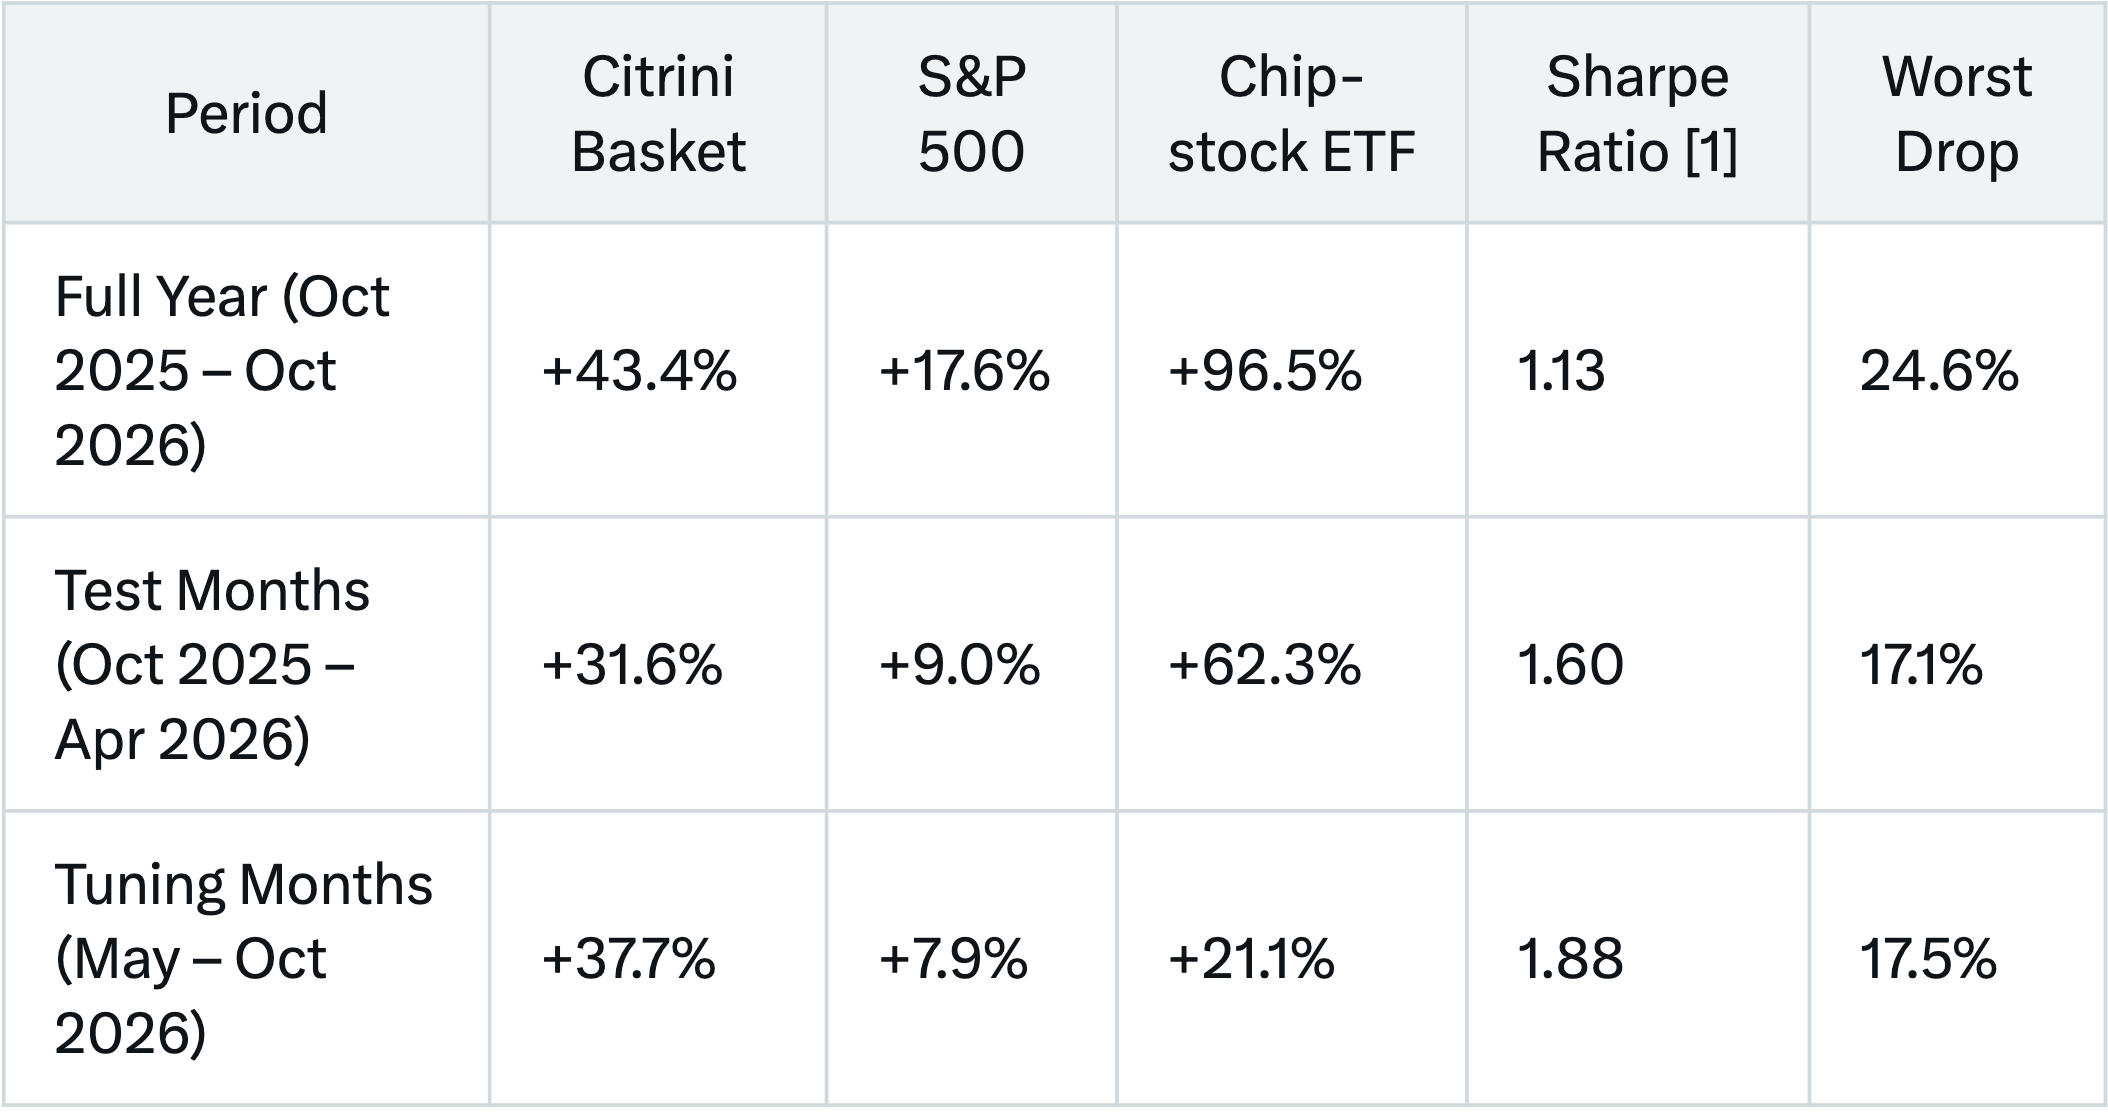
The Citrini Basket beat the S&P 500 in every period, even over the independent Test Months.
It did, however, trail the Chip-stock ETF, which is arguably the best result anyone could
have picked with hindsight - a single-sector bet on the year’s strongest theme.
In short, the Citrini Basket is a patient, cheap, and rules-based way to own the stocks that Citrini talks about. It is not evidence that Citrini can pick stocks, and it is not meant to be a bet that beats the chip sector.
The rules that did not make it
Whenever you come across a typical basket product, you’ll see a nice green line trending upwards. We are showing you the ideas that failed, because it is crucial for someone who participates in algorithmic strategies to understand model refinement. The Citrini Basket was one of over thirty different sets of rules we tested.
The chart below shows a sample of seven of these strategies, each one simulated across two periods: the Tuning Months (i.e. months we tuned it on) and the Test Months (i.e. months it had never seen). The names of the strategies are self-explanatory so we won’t go into the details - but the point should be quite clear.
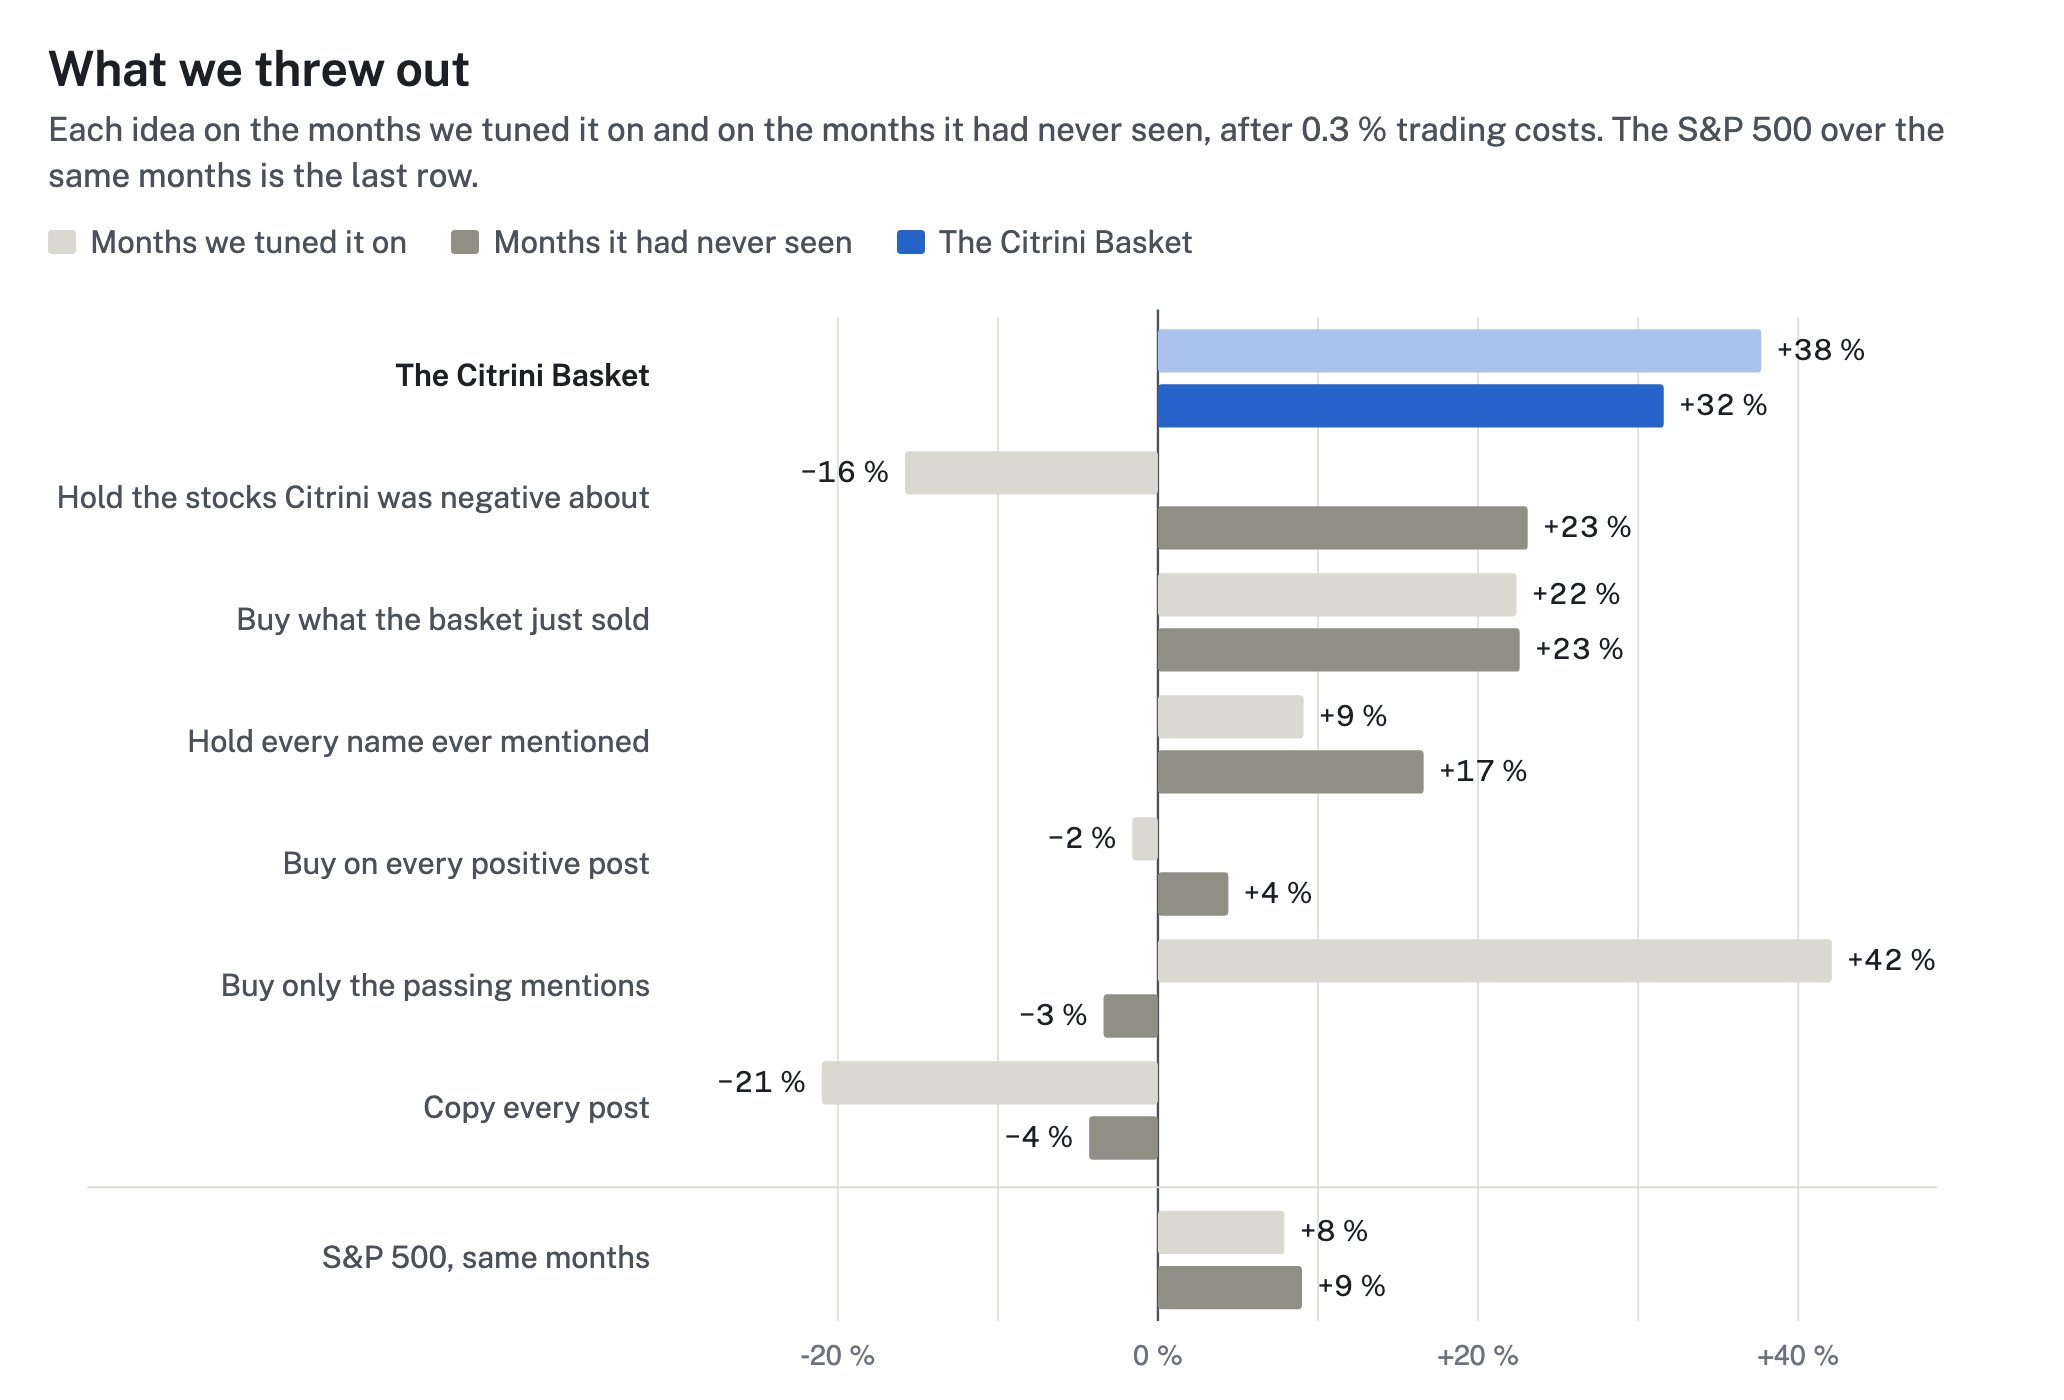
Chart 2: Backtest simulations across seven different sets of rules run against Citrini’s posts, benchmarked against the S&P500.
What we learnt
- What you buy matters less than how you trade it. Whether a post sounded excited, mildly positive or dismissive made no measurable difference to what the stock did next. The fact that Citrini mentioned it was the entire signal. Acting on it in a disciplined manner instead of reading too much into it, was what ended up making money.
- Don’t overtrade - churning is bad for you. Holding each stock for at least six weeks and refreshing weekly, reduced the number of trades by about 85% when compared to acting immediately on every signal. Letting the stock ride the narrative was key.
- Small tweaks in the rules swing results significantly. Rebalancing on Fridays instead of Mondays could turn turn a -25% result into -5%, for example. Hence the need for an iterative backtest.
Live tomorrow on Treasures
The Citrini Basket goes live on Copytrade by Treasures tomorrow. Treasures is not affiliated with or endorsed by Citrini; we trade on public posts, the same ones anyone can read. Once a week it holds up to seven stocks the account has recently talked about, keeps each position for at least six weeks, and sits in cash when less names qualify.
We did the research and published it so you do not have to take anyone's word for it, ours included. If you copy it, copy it for what it is: a patient, rule-based way to reflect confidence in Citrini's views of the market.
About Treasures
Treasures is a Neobrokerage-as-a-Service solution built on tokenized stocks, powering stock trading in neobanks, AI agent ecosystems and hedge funds. Our SmartRoute aggregator routes across all of the leading issuers and blockchains to offer the deepest catalog in the market, with over 2,000 tokenized stocks available today. Our Copytrade and Signals products surface alpha from well-known market participants - allowing both our users and integrators to access high-quality asset curation. Over the next few weeks, we will be launching Onchain SMAs, our flagship institutional B2B offering connecting traditional asset managers with corporate clients onchain. With a single integration to the Treasures API or Agent Skill, partners can now launch full-fledged neobrokerage services in just a matter of hours.
Trade at app.treasures.io: https://app.treasures.io
Build with the Treasures API: https://docs.treasures.io
Follow Treasures on X: https://x.com/treasures_io
Footnotes
[1] The Sharpe ratio is return per unit of bumpiness: how much you made for the ups and downs you sat through. Above 1 is good; below 0 means you lost money and had a wild ride doing it. For perspective, the S&P 500's Sharpe over the same year was 1.37 against the Citrini Basket's 1.13, so the basket made more but gave a bumpier ride.
[2] None of the above constitutes investment advice. The performance of all strategies were simulated with only a year’s worth of data, in a roaring chip market. Numbers may not necessarily match other independent research, as they were obtained on a best-effort basis.